The recent advancement of AI tools and the loss of third-party website cookies have both altered the landscape for marketers. Both speak to the need to further personalize experiences for customers and prospects — at events and beyond.
The combination of losing a data source but having more tools to analyze data has prompted many marketers to look even more closely at events. Data from events can provide the insights needed to stand out among competitors. More and more teams understand that the volume of insights generated is far greater than that of any other marketing channel.
But how do you turn event data into actionable data? We’ve put together this post as a quick guide to help you put your event data into the context of your buyer’s journey.
Identify Desired Data Points Early
Start event analysis right when event planning begins. As with any campaign, setting goals for an event-related campaign and determining how you will measure success beforehand makes calculating results easier. Sharing those goals with your event team in advance also helps them configure their events more intentionally.
So, how do you decide which metrics to pursue? The following are best practices for goal-setting:
- Pinpoint what you don’t already know about your audience. Events are the ideal way to capture preferences, interests, and behaviors. Everything from session attendance to dietary selection can help you fill in the gaps in customers’ profiles.
- Consider each internal team’s needs. Often marketers and event teams focus on common aggregate numbers, such as an increase in registration year over year, total session attendance, or the number of exhibitors who committed to future events. While these macrotrends are valuable, especially to many executives, events have so much more to offer. Data on trends such as individual sessions’ popularity enable marketing, sales, and customer success teams to engage in meaningful conversations with their high-priority contacts.
- Discuss how you will use event data to meet the audience’s needs. Consider the following questions: What’s missing from your customer profile? How can you further personalize customer touchpoints? How can you enhance your outreach effectiveness? For example, our team asks attendees for their region during registration for our flagship INSIGHT event so we can market to them during their working hours.
- Refer to past data. Look at any available past data to determine what data points you want to continue gathering and which data points have proven to be less useful. Building year-over-data also helps demonstrate improvements and identify gaps in event measurement.
Score Event Actions To Visualize Customer Engagement
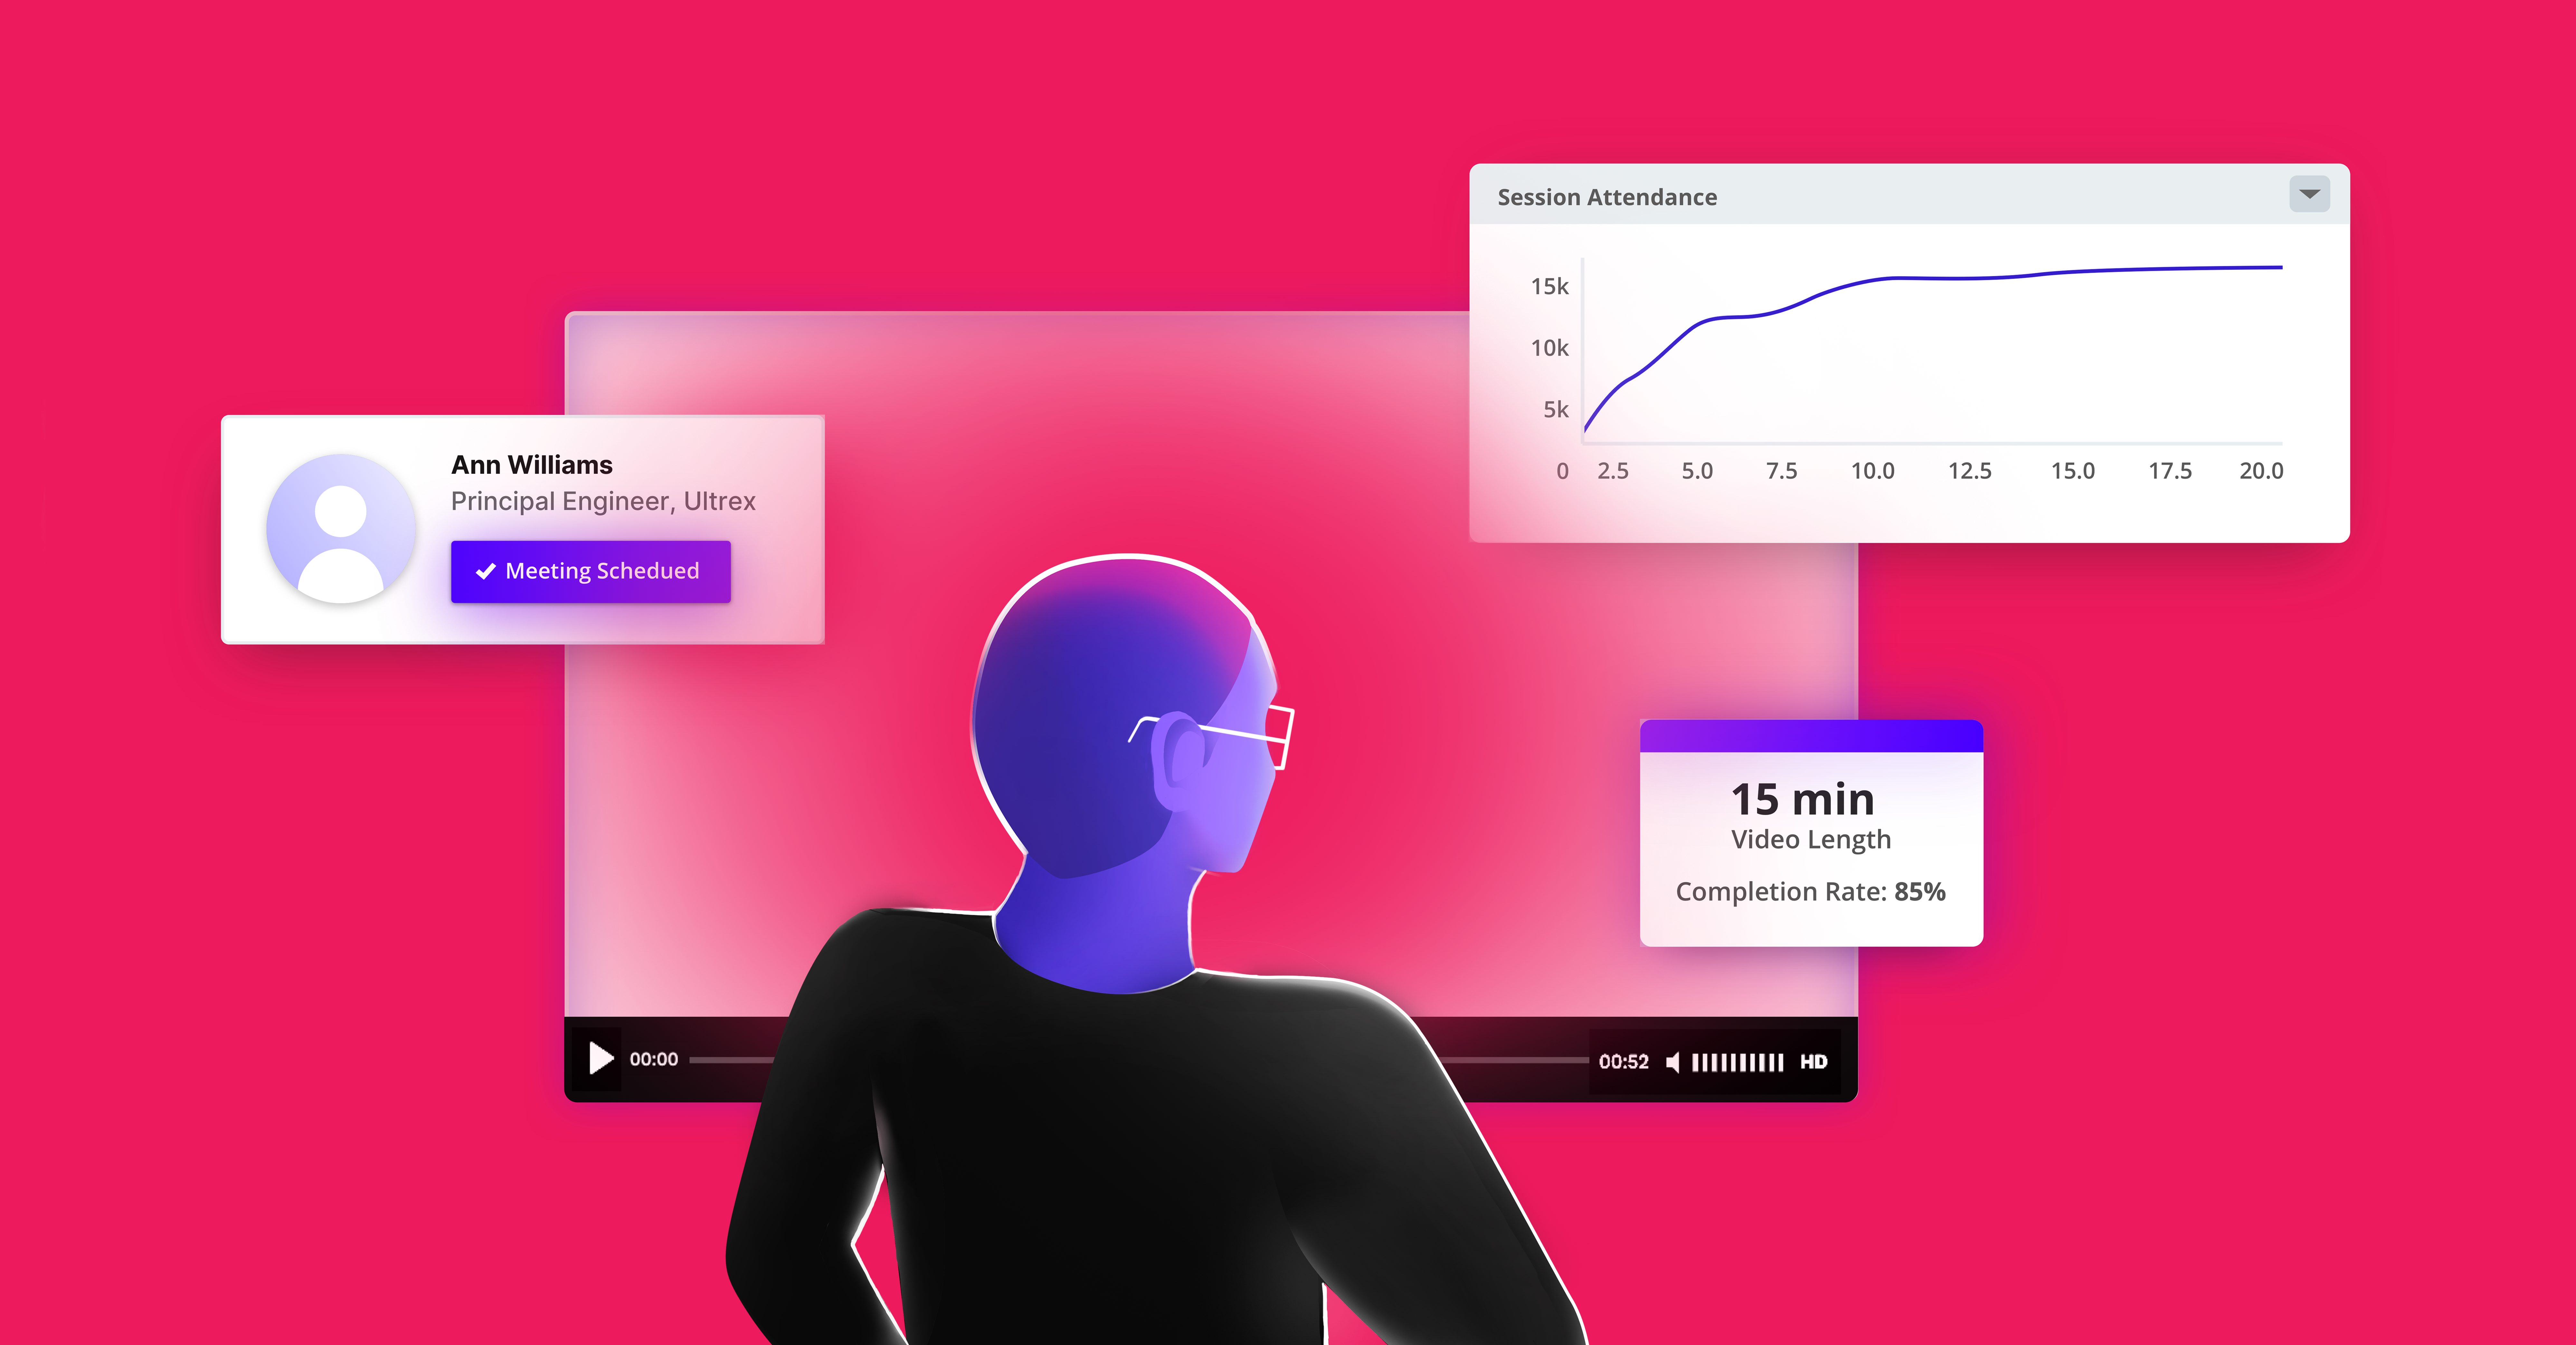
Scoring attendee actions enables teams to identify high-priority attendees throughout the event. Intent scoring is a common best practice, but many teams do not yet apply it to events. Here are a few pointers for scoring event engagement:
- Define event actions as interesting moments in your marketing platform to alert sales of event opportunities in real time.
- Set the viewing thresholds for virtual event content based on your goals, such as qualifying leads or demonstrating community engagement. For example, you might only count a session as “attended” if an attendee spends 20 seconds on the content.
- Determine how you will weigh event actions in relation to other engagement signals, such as email CTR or form fills.
- Tweak your scoring system as your team delivers more events to arrive at the right scoring system.
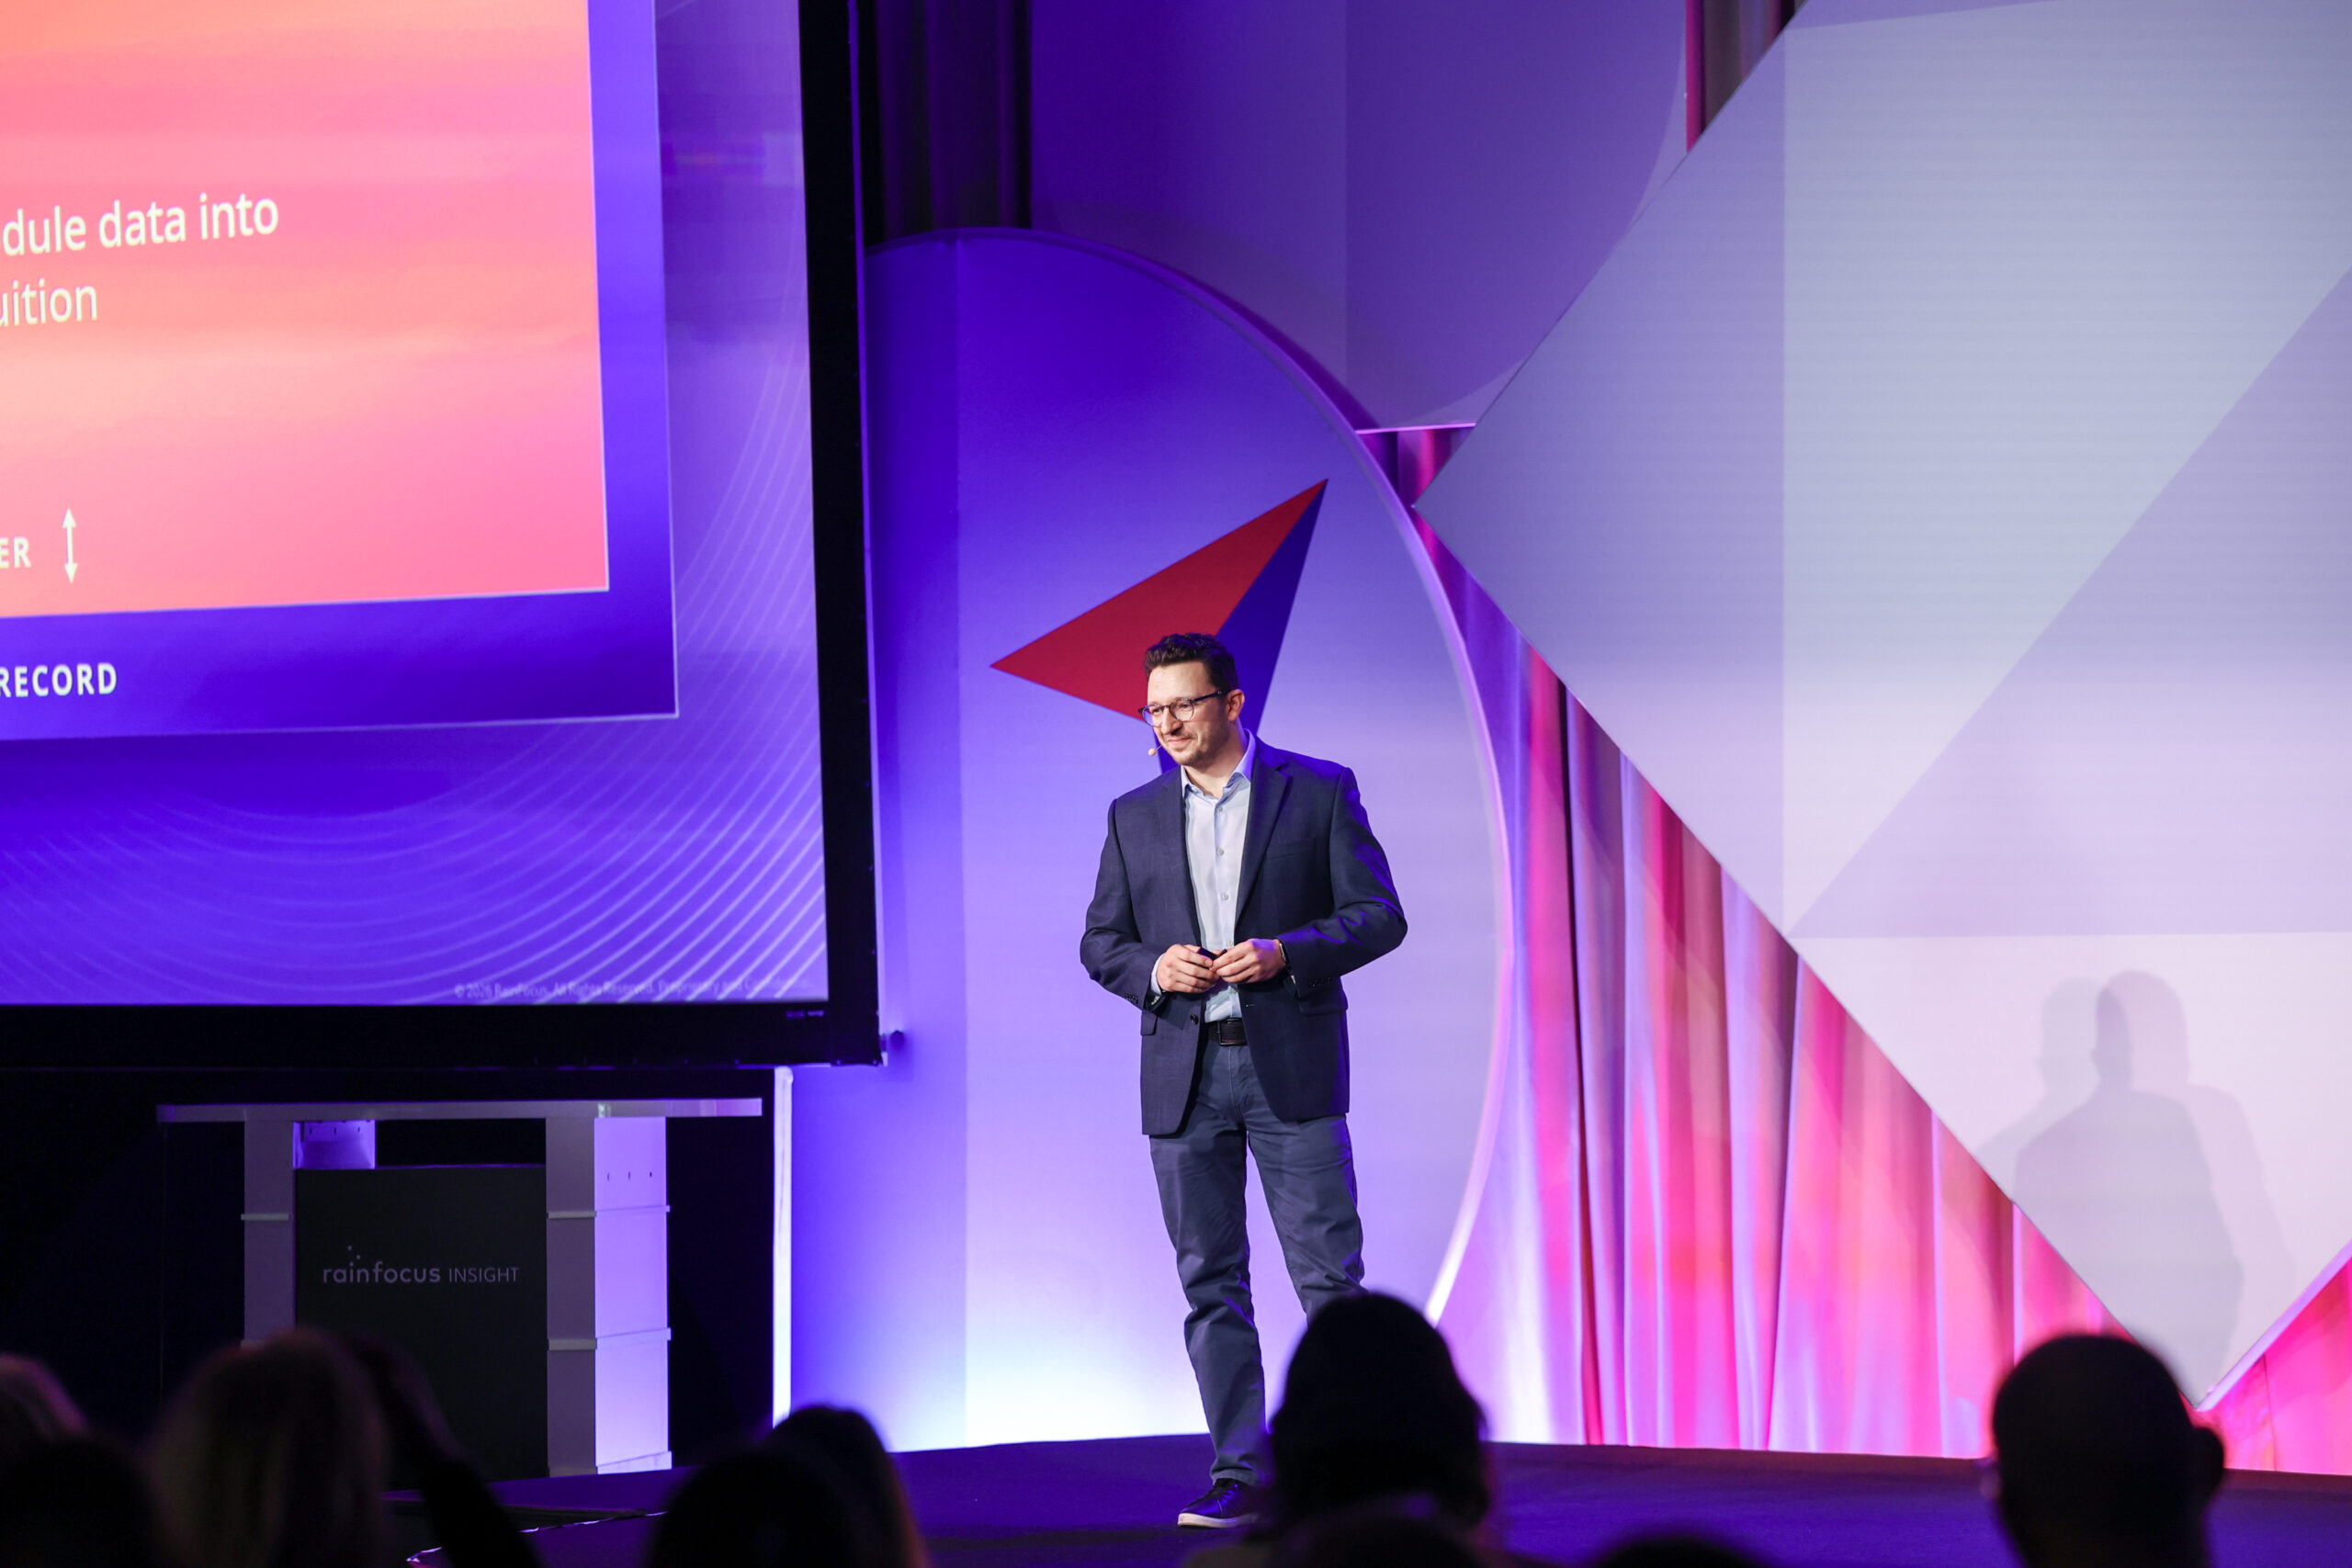
Integrations can make any data sharing and interpretation easier. As shared during the opening keynote of INSIGHT this year, RainFocus partners with Adobe and Salesforce to bring event data to sales and marketing professionals so they can see customers’ engagement scores and act in real time. Discover how other teams are using RainFocus to capture, interpret, and use customer data by watching INSIGHT sessions on demand.